Below i publish a story of the simplistic peoples way of looking at a market. The fundamentals show us a major stock market crash is on the near horizion….. that takes a lot of work. Lines on a chart a monkey can do!
S&P 500’s support is at 3900, then 3760 — the December 2022 low
The stock market, as measured by the S&P 500 Index SPX, +0.53%, has fallen below the 4100 level. That is significant because there previously was triple resistance at that level, and when SPX broke out above that level in late January, it seemed as if the next leg of the “new” bull market was underway. Yet SPX has not only fallen below that supposed support level, it’s confirmed the pullback by trading all the way down to 4000. It appears that breakout above 4100 was a false one. Those are dangerous in bear markets (we last saw one in January 2022). So, now there is resistance at 4200 (the early February highs), and while there might be some small support levels just below current levels, the major support is at 3900, and then 3760-3850. If SPX falls below 3760 (the December low) that would be an extremely negative development.
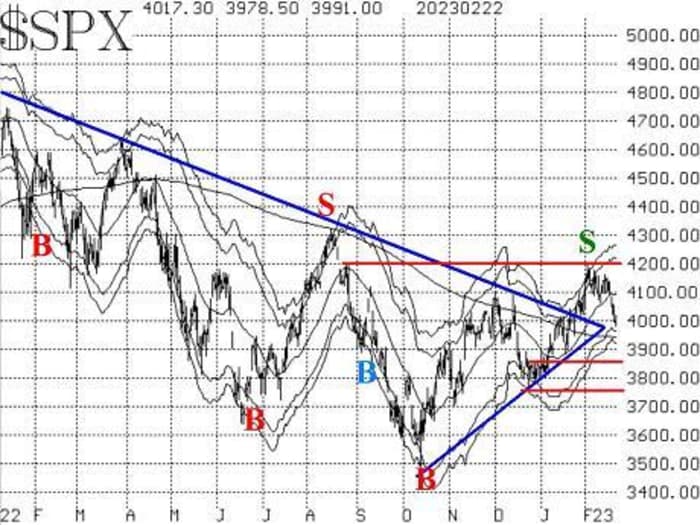
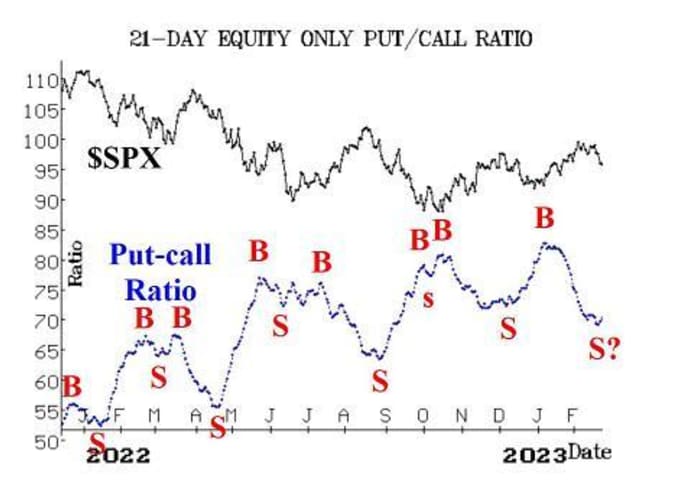
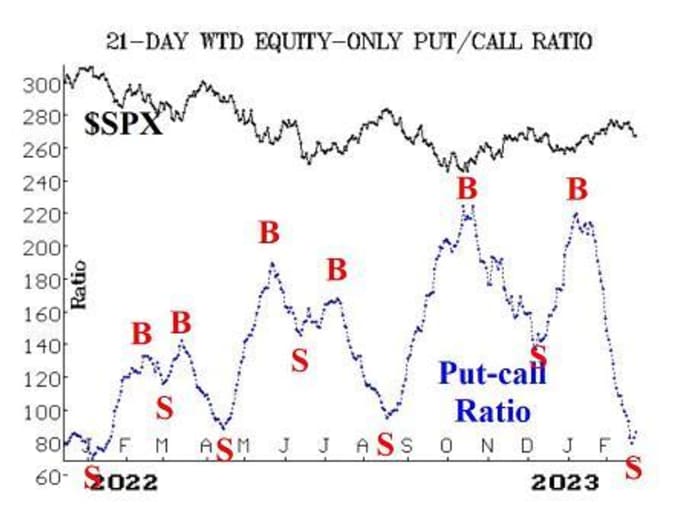
The McMillan Volatility Band (MVB) sell signal that was issued in early February remains in place. Its target is the -4σ “modified Bollinger Band” which is currently at about 3920, but is falling. Equity-only put-call ratios are beginning to weaken as well. The weighted ratio is now on a sell signal, according to our computer analysis programs (as well as the naked eye). This sell signal is emanating from a very low (i.e., overbought) level, and the last two from this level were sell signals in April and August of 2022 — both strong sell signals. Meanwhile, the standard ratio has also curled upward, but our computer analysis programs are not yet “saying” that this is a sell signal. This latest rise has a question mark on the accompanying chart.
Market breadth, which had been a stalwart of the bullish indicator on the way up in December and January, has weakened considerably. Both breadth oscillators generated confirmed sell signals as of February 17th. The decline since then has been swift, and breadth has been very negative, including one 90% down day. That means that the breadth oscillators have already reached oversold status. Still, the market can decline while these oscillators are oversold, so “oversold does not mean buy.” We need to wait for a confirmed buy signal here before acting. Another indicator that has been bullish for quite some time is “New 52-week Highs vs. New 52-week Lows.” This buy signal is in jeopardy of being stopped out, although even if that happens, a new sell signal is not necessarily in place. On Feb. 22, for the first time this year, New Lows outnumbered New Highs on the NYSE. If that happens again, this indicator’s buy signal would be stopped out, and the indicator would return to neutral status. A sell signal requires that New Lows outnumber New Highs for two consecutive days, and that the number of New Lows is greater than 100 on each of those two days. The volatility complex indicators are weakening but have not turned bearish yet. First, VIX VIX, 1.23% has returned to “spiking” mode — meaning that it has risen more than 3.0 points over a three-day (or shorter) time frame. That is an oversold condition. Market breadth, which had been a stalwart of the bullish indicator on the way up in December and January, has weakened considerably. Both breadth oscillators generated confirmed sell signals as of February 17th. The decline since then has been swift, and breadth has been very negative, including one 90% down day. That means that the breadth oscillators have already reached oversold status. Still, the market can decline while these oscillators are oversold, so “oversold does not mean buy.” We need to wait for a confirmed buy signal here before acting. Another indicator that has been bullish for quite some time is “New 52-week Highs vs. New 52-week Lows.” This buy signal is in jeopardy of being stopped out, although even if that happens, a new sell signal is not necessarily in place. On Feb. 22, for the first time this year, New Lows outnumbered New Highs on the NYSE. If that happens again, this indicator’s buy signal would be stopped out, and the indicator would return to neutral status. A sell signal requires that New Lows outnumber New Highs for two consecutive days, and that the number of New Lows is greater than 100 on each of those two days. NN: Gobbledygook…. Self fulfilling prophecies. If they spend a trillion dollars chasing this shit… for a while anyway it appears to work…