Their must be a thousand videos on Golden Crosses.. They really suck the traders in. We will cash out of our long positions as they cash in. And roll into a bearish short.
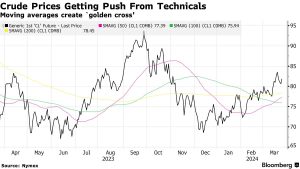
A “golden cross” occurres when the 50 day, 100 day and 200 day moving averages cross. This type of activity indicates that a strong bullish momentum is about to unfold, which could lead to further gains for crude oil.
It doesn’t happen often, but when it does the markets buzz. As long-term indicators carry more weight, a golden cross scenario suggests that a bull market could be on the horizon. This is usually reinforced by high trading volumes which means crude oil could be about to boom.
The fundamentals are being driven by 2 wars and OPEC+ production cuts. THE technical backdrop is extremely bullish with crude’s moving averages forming a golden cross. That’s when an asset’s 50-day moving average exceeds the corresponding 100- day and 200-day figure. Its last formation for the generic oil contract saw WTI surge by more than $25 a barrel. From its June low of $65 to above $90 in September.
This latest Golden Cross happened as U.S. crude futures have risen from around $70 a barrel at the start of the year to above $83. It’s left the 50-day, 100- day and 200-day moving average for WTI oil looking to move above the $90 September high. Projecting oil over $95 bases WTI. That puts BRENT over $98. It’s a classic Golden Cross that often signals a continued bullish trend to new highs. Usually followed by a crash.
blackmask market news and commentary
Casing In On The Golden Cross