- SPX reached a new record high on
- Thursday, October 21, closing at 4,549.78, which puts the trajectory of the index into the upper half of the latest redzone forecast range.
- The market is experiencing greater-than-typical levels of volatility.
- The market-moving headlines of the week point to several contributing factors for what new information has contributed to improving the outlook for investors.
Given all the issues that are dominating the news, would you have guessed the S&P 500 (Index: SPX) would reach a new record high? The index closed at a record high of 4,549.78 on Thursday, October 21, 2021, which puts the trajectory of the index into the upper half of the latest redzone forecast range:
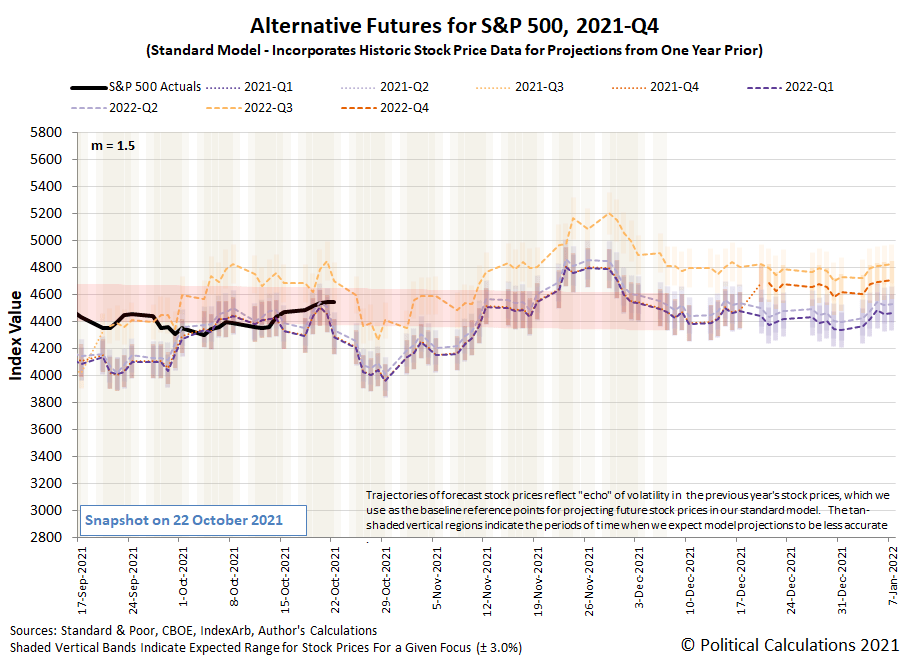
Sharp-eyed readers will catch that the trajectory of the range has itself shifted upward, which is a result of the “dynamic” method we use to set it. When we bridge across periods where the echoes of past volatility in stock prices affect the dividend futures-based model’s projections, the past end of the range is fixed, while the future end “floats” with changes in expectations. For the chart, the rising expectations for the future now means parts of the S&P 500’s actual trajectory that were once within the redzone forecast range now fall outside of it. That’s visible by design in this period, because we set the total width of this forecast range to be plus or minus three percent of the historic typical level of volatility for stock prices. Under typical volatility levels, the trajectory of the index should generally fall well within that statistically determined range. But as the chart visually confirms, the market is experiencing greater-than-typical levels of volatility. For us, what that means is that when we get around to projecting the S&P 500’s future trajectory for 2021-Q4, we’ll need to generate a new redzone forecast, since today’s stock prices will become the base reference points from which we project the future for the index in that period. The echoes of today’s volatility will affect the accuracy of the dividend futures-based model’s projections a year from now. The market-moving headlines of the week point to several contributing factors for what new information has contributed to improving the outlook for investors. was: NN: their is a lot of hyper-blow out their. Their is so much money in the markets because of stimulus insanity everyone is a market Grue. Reality is a precious few really understand what is going on. To be more precise A epic stock market crash is coming. Driven by embedded inflation… And a soon to be desperate FED that has gotten it so wrong…. again. You got to love these pompous pricks they have allowed us to take million out of the market over and over again. So we wait for the stock market rally to continue. We are shorting oil, soon we will short bitcoin and gold. and the big Kahuna,….. A stock market wipe out that will make 1929, 1987, 1990, 1997, 2000-2001, 2007-2008, 2020 look like a cake walk……. I predict our greatest trades ever is this coming stock market crash which will be the 2022-2023 biggest market disaster yet. We need to get our ducks lined up in a row.