The Labor Department’s latest summary of the Consumer Price Index, released on Friday, shows that price increases accelerated again during May, with the “all items index” increasing 8.6% from one year ago, and a 1% increase month-over-month. That follows a one-month reprieve in April, when the CPI numbers were up 8.3%, giving some people hope that inflation had peaked. NB: Look carefully at the chart of the 12 month percentage change below. That little hook at the end could be worth millions to us. It is my belief inflation has peeked.. And its not just the chart

The 8.6% increase is the highest since 1981, and was higher than expected. The “core CPI,” which excludes food and energy prices, increased 6%, which was also more than expected, and many of the broader price increases were due to the continuous upward march of food, gas, and shelter costs. Shelter costs, for instance, are up 5.5% year-over-year, gasoline costs (of all types) are up 48.7% year-over-year, and food prices increased 10.1% since last May—and were up 1.2% since April. Other notable price increases from the latest CPI Index include an increase of 12.6% for airline fares, and a 2.9% increase in dairy products year-over-year.
Most of what the FED measures in terms of inflation are survey-based, observable inflation measures. The bond market presents an alternative gauges of inflation in what are known as market-based inflation measures. Real rates are a better approximation for financial conditions, and they allow for easier historical comparisons across time periods 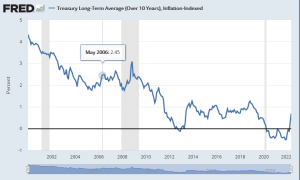
Look at the chart above. It shows inflation starting to peek at the begining of the month. The numbers have donw nothing but improve since then. This is a reliable to use the bond markets as a inflation indicator. As you can see rated that were negative have now turned positive. And if we add the fact that after this chart was generated the 10 year yield soared above 3%. We can look directly at the US Treasury for nominal interest rates, ten year US Treasury filtered for inflation. Provide us a “insiders” view into how economic expectations are filtering through into bond markets. This chart is at the end of May. As we speak the 30 year long bond is trading over 3.25 %. As you can see interest rates are already pricing in the 3 or 4 more FED coming 50 bases point increases. The market and the FED always get it wrong inflation is peeking. This is further indicated by by the supply chain tracker chart below. Please note they will over tighten….. This is not your typical inflation inflation. That is why the algoes AI assholes and doctoral pompous pricks and the clueless FED are having so much trouble figuring it out. The Russian invasion and stupid sanctions on Russian oil and gas created artificial shortages….. Easy to back away from. Supply chain disruptions caused prices to soar. And now the supply chains is OVERSUPPLYED. Want proof just go to the big box stores and see the deflationary in nature massive discounts.
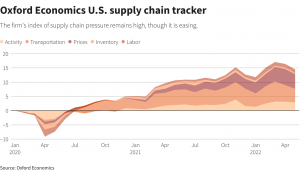
Today’s inflation — which is running at the fastest pace since 1982 — boils down to a simple supply chain mismatch. Economic reopening saw Americans rush back to their normal spending habits armed with pent-up demand and stimulus dollars. But while shoppers’ demand rebounded almost immediately, companies were caught somewhat flat-footed. Product shortages quickly emerged and the imbalance between supply and demand contributed to historically elevated inflation. The supply side of the equation now seems to be steadily healing. Various indicators of supply-chain strain eased further in May after seemingly peaking in March, according to a new index created by Oxford Economics.See chart below. Logistics stress is now the lowest its been since the start of the year, and the trend suggests improvement is accelerating as the broader economy nears a full recovery. Lower stress means more supplies and in fact distribution channels are becoming over supply. Supply above demand means prices will now come down. It will take a few months for the traditional gauges to pick this up.
Oxford Economics
The number of cargo ships waiting to unload in the ports of Los Angeles and Long Beach, California fell for a fourth straight month in May. Inventories rose, helping close the supply-demand gap as Americans’ spending held strong. Prices for goods and services continued to climb, but at a slower pace than the month prior. The Freights Baltic Index, which tracks rates for 40-foot shipping containers, fell to $7,370 for the week that ended June 3. That’s the lowest reading since July 2021 and down from the September high of $11,100. Another driver of inflation that is abating. See chart below
The steady decline in shipping rates offers an even rosier picture of the supply chain’s recovery. The latest declines are among the largest since rates peaked in the fall of 2022. Lower shipping rates help ease inflationary pressures throughout the economy, as elevated prices in the logistics sector lead to higher input costs for all kinds of manufacturers and services. In conclusion: I expect downward pressure on the stock market to continue. I am looking for a further velocity breakdown to the down side. It could come any time as the market believes inflation will run out of control and throw in the towel. This is close most all analysts are extremely negative.That is a wrong assessment. Inflation is peeking and soon will be seen the the CPI and PPI topping. These are lagging indicators. When we see capitulation we will buy back our shorts and add to the long side looking for a relief rally. If we get it right we will sell out long positions. Its going to be a rough and dangerous ride. And i can be full of shit and we we will lose our collective asses…..
xxxx