An invasion into the Ukraine by Russian troops on 24 February 2022 has as of yet not resulted in a loss of oil supply to the market. Prices nevertheless surged by USD 8/bbl to USD 105/bbl following the news, on expectations that sanctions against Russia would cripple energy exports. It is currently unclear what the impact of sanctions will be on energy flows and how long any potential supply losses will last. Russia is the world’s third largest oil producer behind the United States and Saudi Arabia. In January 2022, Russia’s total oil production was 11.3 mb/d, of which 10 mb/d was crude oil, 960 kb/d condensates and 340 kb/d NGLs. By comparison, US total oil production was 17.6 mb/d while Saudi Arabia produced 12 mb/d. Russia is the world’s largest exporter of oil to global markets and the second largest crude oil exporter behind Saudi Arabia. In December 2021, it exported 7.8 mb/d, of which crude and condensate accounted for 5 mb/d, or 64%. Oil product exports totalled 2.85 mb/d, of which 1.1 mb/d of gasoil, 650 kb/d of fuel oil and 500 kb/d of naphtha and 280 kb/d of vacuum gas oil (VGO). Gasoline, LPG, jet fuel and petroleum coke made up the remaining 350 kb/d.
Russian crude and oil product exports, Jan 2020-Dec 2021
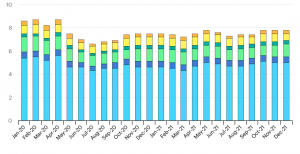
About 60% of Russia’s oil exports go to OECD Europe, and another 20% go to China. In November, the latest month for which official monthly oil statistics are available, OECD Europe imported a total of 4.5 mb/d of oil from Russia (34% of its total imports), of which 3.1 mb/d was crude oil and feedstocks and 1.3 mb/d oil products. OECD Asia Oceania imported 440 kb/d of total oil from Russia in November (5% of total imports), while the OECD Americas imported 625 kb/d (17% of total imports). Roughly 750 kb/d of crude oil is delivered to Europe via the Druzhba pipeline system. Most immediately at risk are the ~250 kb/d of Russian oil transiting Ukraine via the southern branch of the Druzhba pipeline to supply Hungary, Slovakia and the Czech Republic. China is the largest single buyer of Russian oil, taking 1.6 mb/d of crude on average in 2021, equally divided between pipeline and seaborne routes. Russia is also a significant supplier of crude to Belarus, Romania and Bulgaria, and of products to most of the FSU countries, including Ukraine.
OECD oil imports, total and from Russia, November 2021
Thousand barrels per day
| Total oil | Crude oil + NGLs + feedstocks | Total products | |||||||
|---|---|---|---|---|---|---|---|---|---|
|
Total |
Russia |
Share |
Total |
Russia |
Share |
Total |
Russia |
Share |
|
| Australia | 960 | – | 0% | 145 | – | 0% | 815 | – | 0% |
| Japan | 3 993 | 126 | 3% | 2 894 | 122 | 4% | 1 098 | 4 | 0% |
| Korea | 3 678 | 313 | 9% | 2 713 | 155 | 6% | 966 | 157 | 16% |
| New Zealand | 126 | – | 0% | 67 | – | 0% | 59 | – | 0% |
| OECD Asia Oceania | 8 589 | 439 | 5% | 6 046 | 277 | 5% | 2 543 | 161 | 6% |
| Canada | 960 | – | 0% | 709 | – | 0% | 251 | – | 0% |
| Chile | 334 | – | 0% | 109 | – | 0% | 224 | – | 0% |
| Mexico | 1 036 | – | 0% | 10 | – | 0% | 1 025 | – | 0% |
| United States | 8 533 | 626 | 7% | 6 836 | 478 | 7% | 1 698 | 147 | 9% |
| OECD Americas | 3 687 | 626 | 17% | 2 574 | 478 | 19% | 1 113 | 147 | 13% |
| Austria | 291 | 8 | 3% | 156 | 8 | 5% | 135 | – | 0% |
| Belgium | 1 189 | 278 | 23% | 648 | 183 | 28% | 541 | 95 | 18% |
| Czech Republic | 244 | 52 | 21% | 138 | 52 | 38% | 106 | – | 0% |
| Denmark | 189 | 28 | 15% | 90 | – | 0% | 99 | 28 | 28% |
| Estonia | 38 | 13 | 34% | – | – | 0% | 38 | 13 | 34% |
| Finland | 309 | 246 | 80% | 240 | 201 | 84% | 69 | 45 | 65% |
| France | 1 844 | 233 | 13% | 736 | 98 | 13% | 1 108 | 135 | 12% |
| Germany | 2 748 | 835 | 30% | 1 877 | 687 | 37% | 871 | 149 | 17% |
| Greece | 683 | 200 | 29% | 568 | 191 | 34% | 115 | 9 | 8% |
| Hungary | 216 | 92 | 43% | 135 | 79 | 59% | 81 | 13 | 16% |
| Iceland | 14 | – | 0% | – | – | 0% | 14 | – | 0% |
| Ireland | 184 | 11 | 6% | 61 | – | 0% | 123 | 11 | 9% |
| Israel | 359 | – | 0% | 310 | – | 0% | 49 | – | 0% |
| Italy | 1 521 | 204 | 13% | 1 235 | 180 | 15% | 286 | 25 | 9% |
| Latvia | 37 | 9 | 24% | – | – | 0% | 37 | 9 | 24% |
| Lithuania | 224 | 185 | 83% | 198 | 173 | 87% | 26 | 12 | 46% |
| Luxembourg | 59 | – | 0% | – | – | 0% | 59 | – | 0% |
| Netherlands | 3 184 | 748 | 23% | 1 321 | 414 | 31% | 1 863 | 335 | 18% |
| Norway | 183 | 45 | 25% | 56 | 10 | 18% | 127 | 35 | 28% |
| Poland | 878 | 509 | 58% | 632 | 372 | 59% | 247 | 136 | 55% |
| Portugal | 310 | 31 | 10% | 144 | 31 | 22% | 166 | – | 0% |
| Slovak Republic | 148 | 109 | 74% | 119 | 109 | 92% | 30 | – | 0% |
| Slovenia | 75 | – | 0% | – | – | 0% | 75 | – | 0% |
| Spain | 1 677 | 183 | 11% | 1 337 | 134 | 10% | 340 | 49 | 14% |
| Sweden | 492 | 43 | 9% | 338 | 31 | 9% | 154 | 12 | 8% |
| Switzerland | 202 | – | 0% | 73 | – | 0% | 129 | – | 0% |
| Turkey | 1 201 | 258 | 21% | 736 | 141 | 19% | 464 | 116 | 25% |
| United Kingdom | 1 567 | 170 | 11% | 976 | 56 | 6% | 591 | 114 | 19% |
| OECD Europe | 13 186 | 4 492 | 34% | 9 773 | 3 148 | 32% | 3 413 | 1 344 | 39% |
| OECD Total | 21 465 | 5 556 | 26% | 16 240 | 3 904 | 24% | 5 225 | 1 652 | 32% |
Source: Monthly Oil Statistics (MOS). The regional totals do not include intra-regional trade and therefore reflect total imports entering the region and not trade between countries of the region. NN: its a hopeless situation. If they went balls to the wall Manhattan project kid of international effort It would take 5 years and a trillion dollars to replace Russian oil.